The crypto market has crashed, and it seems many would believe crypto was too good to be true and have panicked by dumping their crypto for other financial assets (are stocks doing any better?). Others have become concerned and have sold their crypto for stablecoins, only to have been shaken by the recent crash of UST and LUNA. Still others see the potential for financial opportunity but aren’t sure which coins to purchase and when to purchase those coins.
So, how can we begin to determine when is a good time to invest and which coins should we be investing in? Let’s look at a few key indicators that are available to everyone with internet access, and that should include you as you are reading this article online. The first helpful key indicator in understanding where the market may be going is the “Crypto Fear & Greed Index”. This index provides an overview of the current market from an investor’s perspective and works by estimating the crypto market’s sentiment, as represented by a score of 0 to 100. The lower the score, the greater the fear in the market. The higher the score the greater the greed in the market.
Why Measure Fear and Greed?
The crypto market behavior is very emotional. People tend to get greedy when the market is rising which results in FOMO (Fear of missing out). Also, people often sell their coins in irrational reaction of seeing red numbers. With the Fear and Greed Index, the displayed information is designed to help save you from your own emotional overreactions. There are two simple assumptions:
- Extreme fear can be a sign that investors are too worried. That could be a buying opportunity.
- When Investors are getting too greedy, that means the market is due for a correction.
Therefore, the Fear & Greed Index analyzes the current sentiment of the Bitcoin market and converts the data into a simple meter from 0 to 100. Zero means “Extreme Fear”, while 100 means “Extreme Greed”.
The Fear & Greed Index
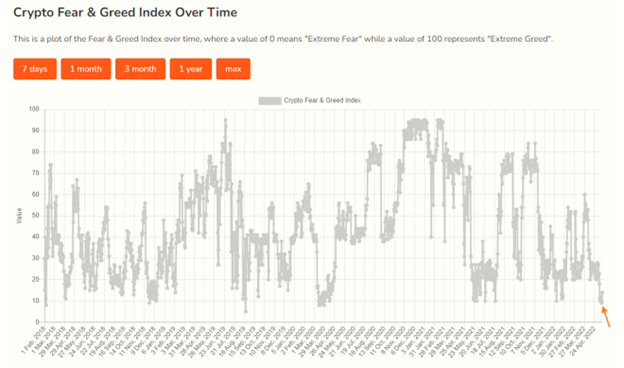
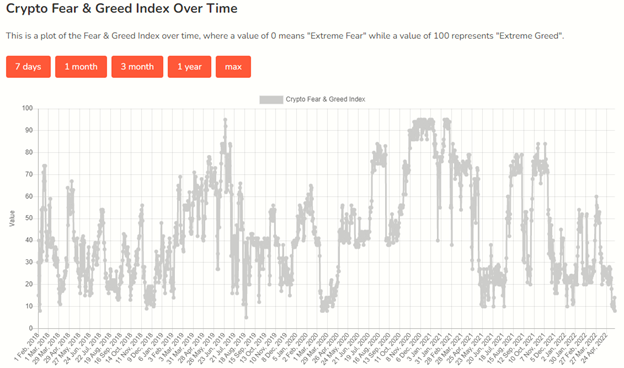
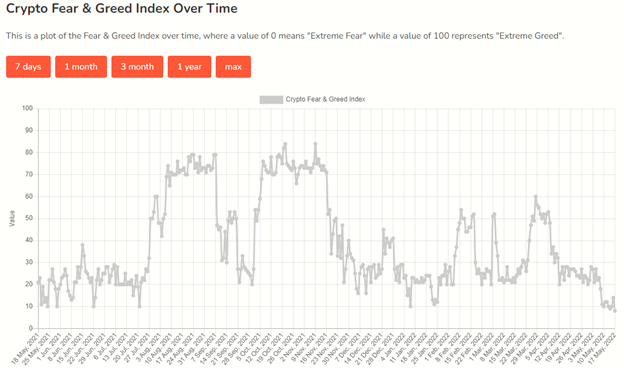
When’s a good time to buy? The best time to buy is when the Fear & Greed Index is and has been in the “Fear” portion of the index, especially if the Fear Index has been extremely low. When is the best time to sell or wait for the market to adjust? When the Greed Index is high. So, what do we see in the Crypto Fear & Greed Index? The following graph shows the Fear & Greed Index (source: https://alternative.me/crypto/fear-and-greed-index/) from February 2018 through today.
Remember, Extreme Greed is a score of 100 and Extreme Fear is a score of 0. If you look at where the market has been the past few days, you can see the Fear Index is at a very low score of about 9 (as shown by the orange arrow). However, you can see it has improved a little bit to about 15.
For a more detailed explanation of the Fear & Greed Index data sources please go to the end of this article.
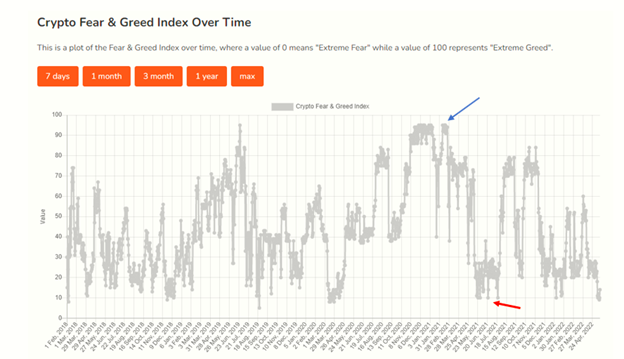
You can see back at the end of 2020 and early 2021 the Greed Index was very high, with scores in excess of 90 (as shown by the blue arrow) for a fairly long period.
How To Use The Fear & Greed Index As An Indicator When Purchasing Crypto
So, how does this impact the market? Let’s start by looking at the price of Bitcoin around a few high fear or high greed peaks and valleys on the Fear & Greed Index. Below is a Bitcoin to USD Chart (source: CoinMarketCap.com) from early 2012 through today. If we compare the high greed peak that was happening in late 2020 and early 2021, there is a direct correlation between the high greed and the high Bitcoin price moving from the $20,000 price to more than $63,000 (as shown by the green arrow)! Then, the index begins to reflect extreme fear in May through August 2021 period. During this period the price of Bitcoin fell to just below $30,000 (as shown by the orange arrow on the chart below and the red arrow above).
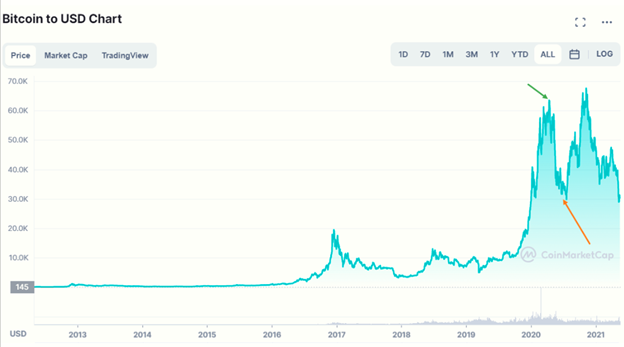
This begins to demonstrate how we can use the Fear & Greed Index as an indicator of when to buy or when to sell or HODL. If you had purchased Bitcoin when the Greed Index was increasing, you would have been able to see some handsome profits, especially if you would have sold those Bitcoins as the Fear Index began to become dominant.
Remember these two points:
- Extreme fear can be a sign that investors are too worried. That could be a buying opportunity.
- When Investors are getting too greedy, that means the market is due for a correction.
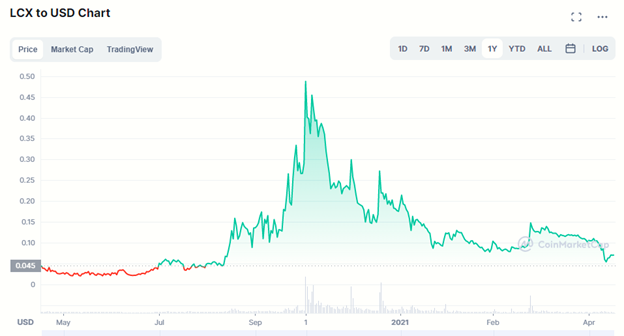
When Is A Good Time To Buy LCX?
When you analyze the LCX to USD Chart (source: CoinMarketCap.com) to the Fear & Greed Index, you can see the LCX Token price follows the ups and down trends of the Fear & Greed Index. Again using the late 2020 and early 2021 period we know the Greed Index was very high and LCX experienced the first significant price increase (as demonstrated by the orange circle below). When the Fear Index became very strong in the May through August 2021 timeframe, LCX price decreased.
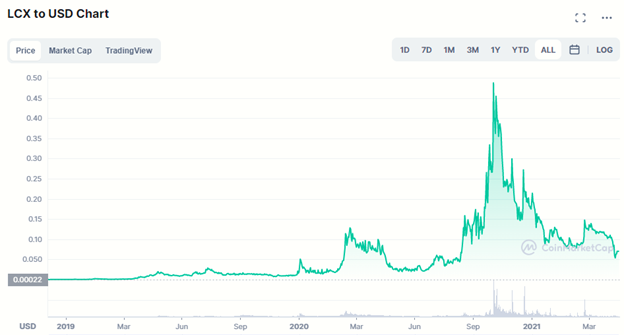
In looking at the charts for the past year, you get a very good idea of how LCX has followed the Fear & Greed Index.
Is LCX A Good Investment Based On The Fear & Greed Index?
By using the Fear & Greed Index as an indicator, it appears that now is an excellent time to buy LCX. The Fear index is very strong at or below 20 and we have seen that when the Greed Index becomes very strong, LCX shows a very strong tendency to follow the index. This indicates the price for LCX has a strong likelihood of achieving significant price increase.
Of course, everyone needs to do their own due diligence and thoroughly research any investment in the crypto industry. However, when examining the LCX Token and the Liechtenstein Cryptoassets Exchange (known as LCX Exchange), the solid fundamentals and strategy of the company provides a strong incentive to purchase LCX Tokens.
Fear & Greed Index Data Sources
We are gathering data from the five following sources. Each data point is valued the same as the day before in order to visualize a meaningful progress in sentiment change of the crypto market.
First of all, the current index is for bitcoin only (we offer separate indices for large alt coins soon), because a big part of it is the volatility of the coin price.
But let’s list all the different factors we’re including in the current index:
Volatility (25 %)
We’re measuring the current volatility and max. drawdowns of bitcoin and compare it with the corresponding average values of the last 30 days and 90 days. We argue that an unusual rise in volatility is a sign of a fearful market.
Market Momentum/Volume (25%)
Also, we’re measuring the current volume and market momentum (again in comparison with the last 30/90 day average values) and put those two values together. Generally, when we see high buying volumes in a positive market on a daily basis, we conclude that the market acts overly greedy / too bullish.
Social Media (15%)
While our reddit sentiment analysis is still not in the live index (we’re still experimenting some market-related key words in the text processing algorithm), our twitter analysis is running. There, we gather and count posts on various hashtags for each coin (publicly, we show only those for Bitcoin) and check how fast and how many interactions they receive in certain time frames). A unusual high interaction rate results in a grown public interest in the coin and in our eyes, corresponds to a greedy market behavior.
Surveys (15%) currently paused
Together with strawpoll.com (disclaimer: we own this site, too), quite a large public polling platform, we’re conducting weekly crypto polls and ask people how they see the market. Usually, we’re seeing 2,000 – 3,000 votes on each poll, so we do get a picture of the sentiment of a group of crypto investors. We don’t give those results too much attention, but it was quite useful in the beginning of our studies. You can see some recent results here.
Dominance (10%)
The dominance of a coin resembles the market cap share of the whole crypto market. Especially for Bitcoin, we think that a rise in Bitcoin dominance is caused by a fear of (and thus a reduction of) too speculative alt-coin investments, since Bitcoin is becoming more and more the safe haven of crypto. On the other side, when Bitcoin dominance shrinks, people are getting more greedy by investing in more risky alt-coins, dreaming of their chance in next big bull run. Anyhow, analyzing the dominance for a coin other than Bitcoin, you could argue the other way round, since more interest in an alt-coin may conclude a bullish/greedy behavior for that specific coin.
Trends (10%)
We pull Google Trends data for various Bitcoin related search queries and crunch those numbers, especially the change of search volumes as well as recommended other currently popular searches. For example, if you check Google Trends for “Bitcoin”, you can’t get much information from the search volume. But currently, you can see that there is currently a +1,550% rise of the query „bitcoin price manipulation“ in the box of related search queries (as of 05/29/2018). This is clearly a sign of fear in the market, and we use that for our index.
Sections of this article originally published via this site
Although the material contained in this website was prepared based on information from public and private sources that LCXwire.com believes to be reliable, no representation, warranty or undertaking, stated or implied, is given as to the accuracy of the information contained herein, and LCXwire.com expressly disclaims any liability for the accuracy and completeness of the information contained in this website.